
October 9, 2026
Claim Denial Reasons: Why Nearly 15% of Claims Get Denied
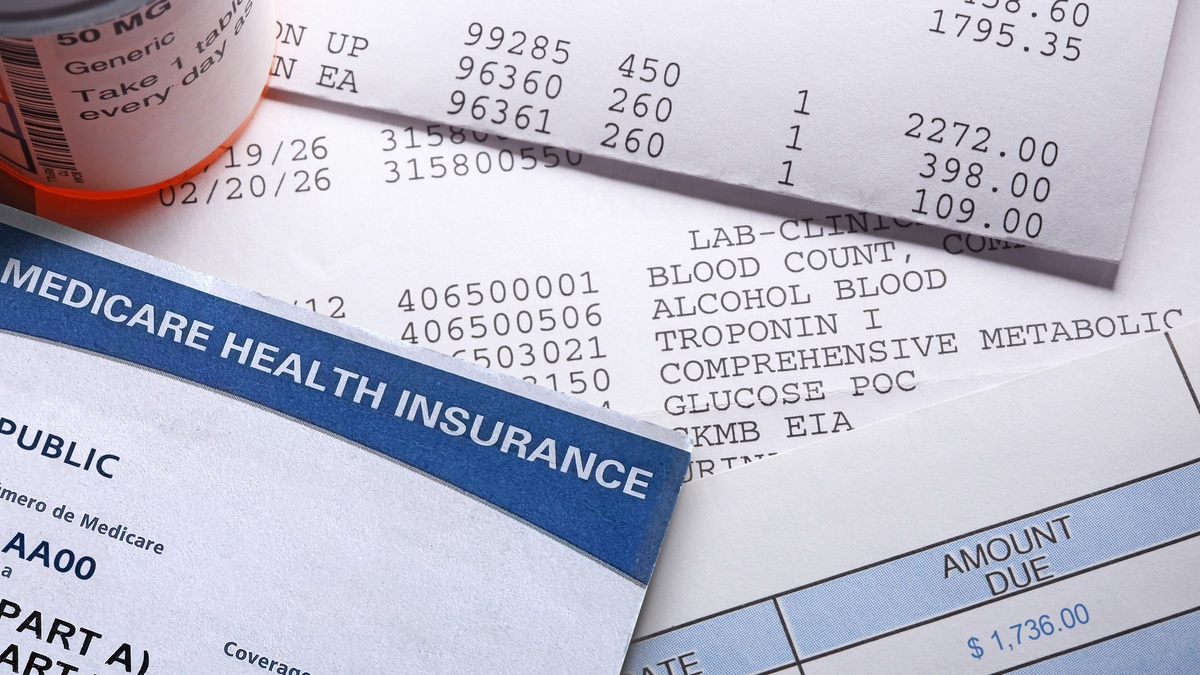
Claim denials aren’t holding steady. Initial denial rates climbed to 11.81% of all claims in 2024, according to revenue cycle data from more than 2,100 hospitals and 300,000 physicians. Among private payers, the picture is even sharper: nearly 15% of claims are initially denied, including claims that had already been pre-approved. And in a Medical Group Management Association poll, 60% of medical group leaders said their denial rates were higher than the year before.
Understanding the most common claim denial reasons is the first step toward preventing them. In this article, we look at how widespread denials have become, the specific reasons claims get denied, why the trend keeps climbing, and the first number to pull if you want to know where your practice stands.
The rising denial rate in medical billing
The denial rate in medical billing varies by payer type, and none of the numbers are comfortable. American Hospital Association data shows Medicare Advantage plans denying 15.7% of claims and commercial insurers denying 13.9%. On the marketplace side, HealthCare.gov insurers denied nearly 1 in 5 in-network claims in 2023, according to a KFF analysis of federal filings.
The pre-approval finding may be the most telling part. Per the same Premier survey data, an average of 3.2% of denied claims had already been approved through prior authorization. Practices did the extra work of securing approval specifically to avoid a denial, and still got denied.
Payer behavior explains part of the trend. Denials tied to requests for more information rose 5.4% in a single year, and Kodiak Solutions’ analysts note that payers appear to be using initial denials to slow payments, even though roughly 90% of claims are ultimately paid.
The most common claim denial reasons
Payers may set the rules, but most denials begin inside the billing process itself. The most frequent claim denial reasons cluster into a familiar list:
- Eligibility issues. Coverage that lapsed, changed, or was never verified before the visit. In one industry survey, 45% of providers named missing or inaccurate data as the root cause of their denials.
- Missing or incomplete documentation. The service happened, but the record doesn’t prove it to the payer’s satisfaction.
- Coding errors and mismatched patient information. A transposed digit or an outdated code can sink an otherwise clean claim.
- Missing prior authorization. Cited by 36% of providers as a driver of rising denials in that same survey.
- Claims filed past a payer’s deadline. These often become hard denials that can’t be appealed at all. Most payers allow 90 to 180 days from the date of service, and some windows are shorter.
Each of these is preventable, which is both frustrating and encouraging. Frustrating because the revenue was collectible all along. Encouraging because prevention sits within your practice’s control, and it costs far less than the appeals process. When a denial does land, the fight gets expensive quickly: rework, appeals, and staff time that add up fast.
Why denials keep rising
If the reasons are so well known, why is the trend still moving the wrong way? Three forces stand out.
Staffing is the first. About 70% of providers dealing with staff shortages say their denial rates are rising, and short-staffed billing teams have less time to check claims before submission and less bandwidth to work denials afterward.
Payer policy churn is the second. 77% of providers say payer policies change more often than they used to, which means a claim process that was clean last quarter can quietly fall out of compliance this quarter.
The third is a surprising step backward on technology. Only 31% of providers now use automation or AI in claims processing, down from 62% in 2022. Practices that returned to manual processes are catching fewer errors before claims go out the door.
The human cost compounds the financial one: in the AMA’s most recent prior authorization survey, 94% of physicians reported that authorization hurdles delay patient care, and medical teams spend more than 12 hours a week on authorization requests alone.
What a healthy denial rate looks like
The AAFP’s benchmark puts the industry average denial rate at 5% to 10%, with below 5% as the target for a healthy practice. Against the current reality of 11-15% initial denials, that gap represents real, collectible revenue.
Calculating your own rate is simple. Divide the number of claims denied in a given period by the total number of claims submitted in that same period, then multiply by 100. A practice that submitted 1,000 claims last quarter and saw 80 come back denied is running an 8% denial rate: above benchmark, and worth a closer look.
Denial rate is one of five numbers that together tell you almost everything about your billing health. And if more than one of those numbers drifts the wrong way at the same time, the pattern usually points to a system issue rather than a staffing one.
What to check first
Pull your denial rate for the last quarter and compare it against the 5% benchmark. It takes one report, and it’s the single most revealing metric in your billing operation.
Then go one level deeper and sort those denials by reason. Two practices can run the same 8% rate for entirely different causes: one losing claims to eligibility issues, the other to timely filing. The category that tops your list tells you which fix comes first. If your billing platform can’t produce that report in a few clicks, that’s a finding in itself.
If your numbers run higher than you’d like, look at where your denials originate before assuming you need more staff hours. Most claim denial reasons take root before submission, in eligibility checks, documentation, and coding. Practices using an integrated EHR and billing workflow catch those issues while they’re still fixable, before the claim ever reaches the payer.
See how your practice compares
The complete data behind rising denials, plus every benchmark to measure your practice against, is in The Independent Practice Billing Playbook.